

Newsletter sponsorships have become a valuable channel for B2B marketers looking to reach highly engaged audiences. Whether the goal is brand awareness, product education, webinar registrations, or demand generation, newsletters offer direct access to communities that have already chosen to pay attention.
Like most marketers, we started by looking at the metrics typically provided by newsletters: opens, clicks, click-through rates, and cost-per-click. Especially in the evaluation phase of selecting newsletter partners.
Those metrics are useful. But they left us with a question:
How much do clicks actually tell us about the audience we're reaching?
To find out, we ran several newsletter sponsorships and used Rebrandly tracking links to measure performance through our own first-party analytics.
What we discovered wasn't a discrepancy in click counts. It was a deeper understanding of audience quality.
The Click Counts Matched More Than We Expected
The first thing we noticed was that the click counts reported by the newsletters closely aligned with the click counts reported by Rebrandly.
That was reassuring.
Both systems were generally measuring the same audience activity, and the overall variance across campaigns was small enough that it wouldn't materially change our decision-making.
If our goal was simply to answer the question, "How many people clicked?", the newsletter reporting was more than sufficient.
But that wasn't the most interesting finding.
The most interesting finding was everything we learned after the click.
Not All Clicks Are Equal
When most marketers review newsletter sponsorship performance, they evaluate success based on click volume and business outcomes.
More clicks often feel like a better result.
But once we started analyzing the traffic through first-party analytics, we realized that click volume only tells part of the story.
Two campaigns with similar click counts can produce very different audiences.
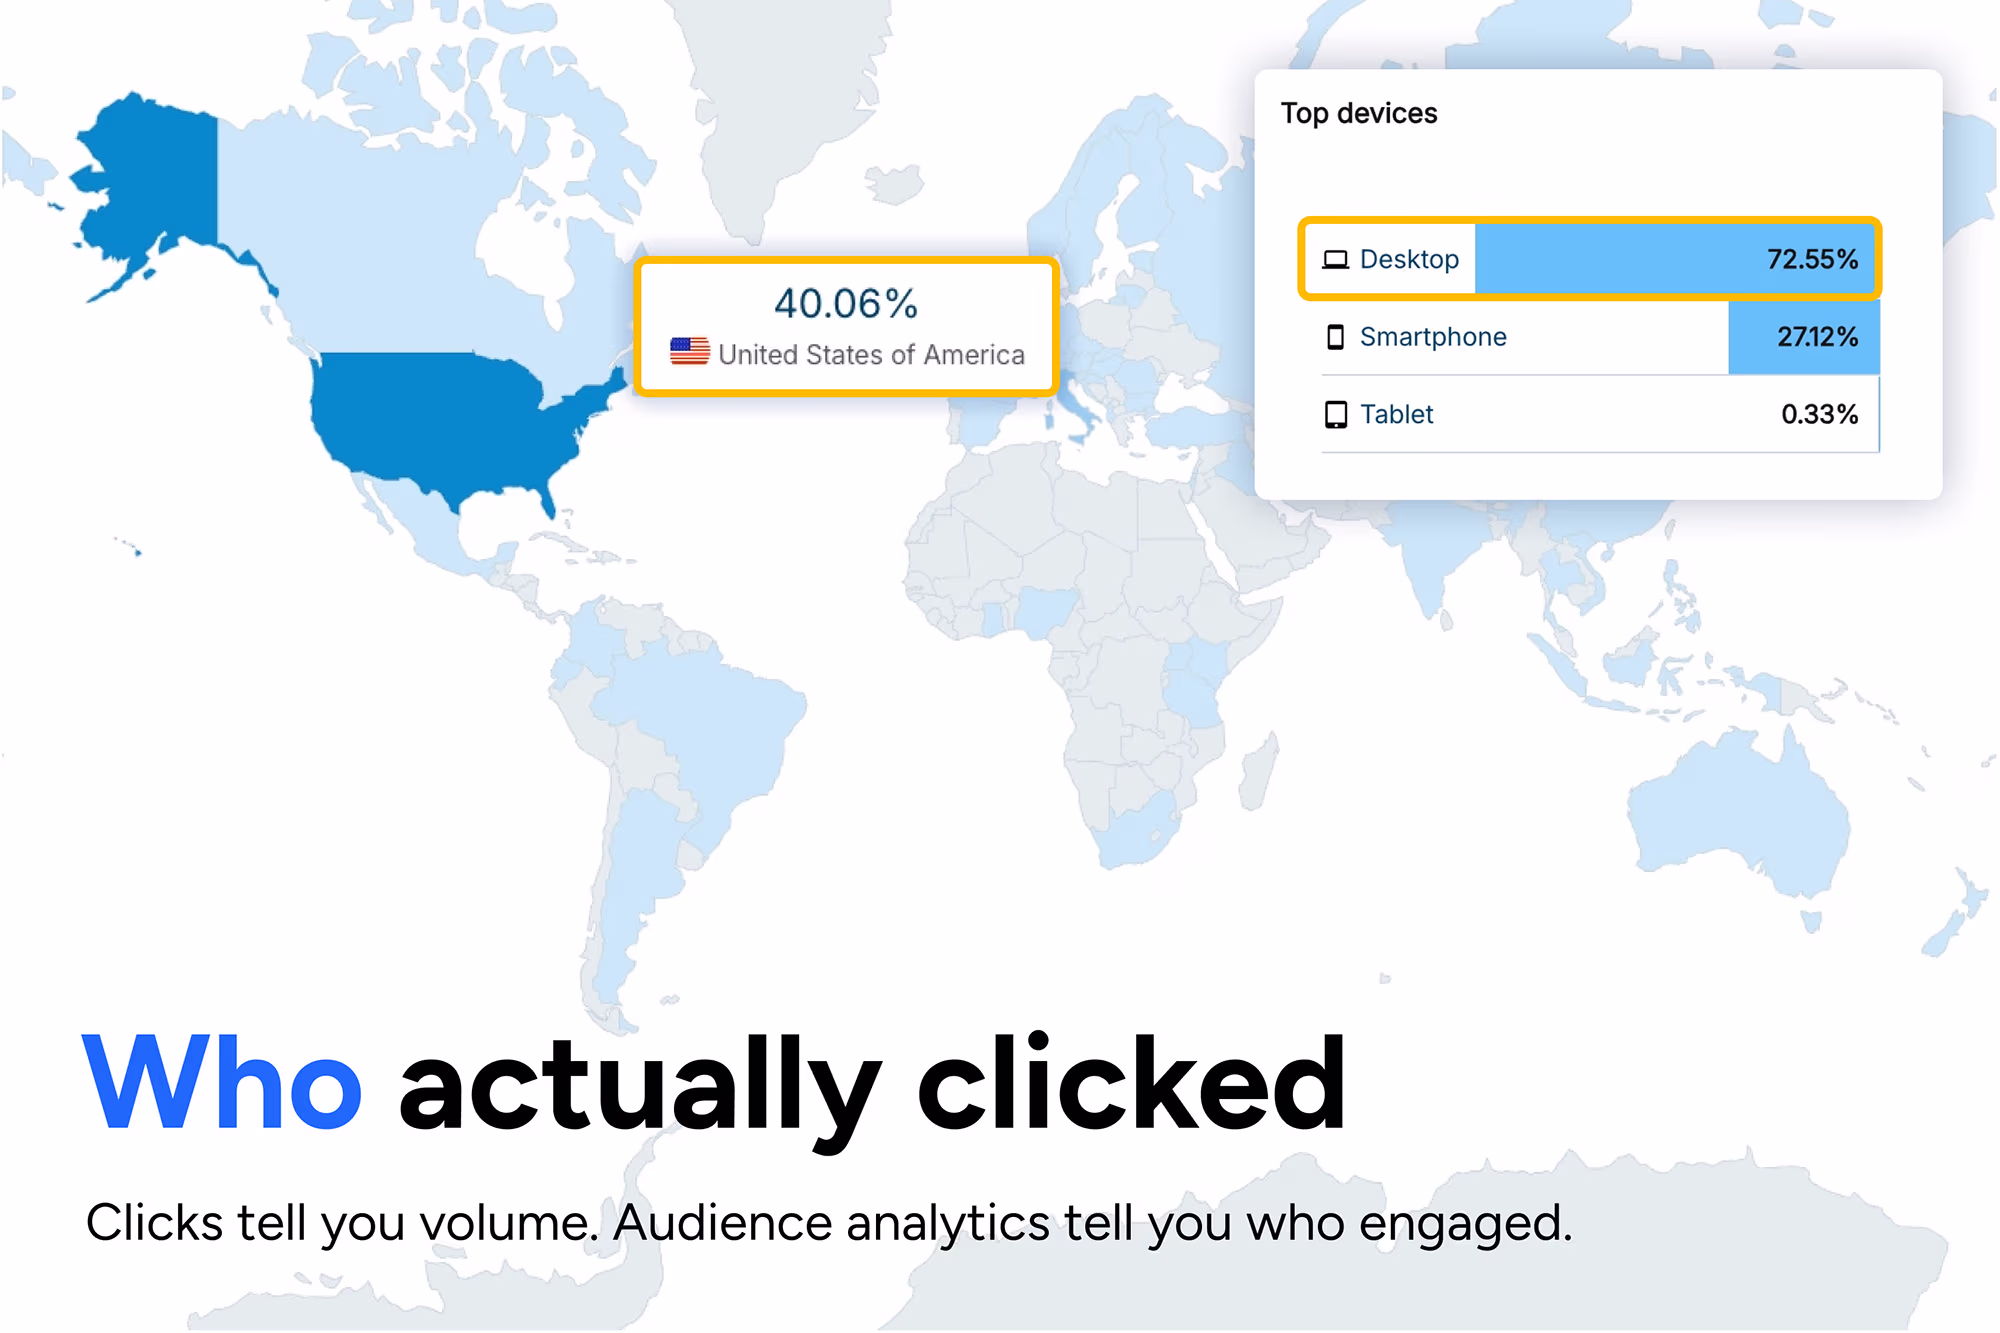
Some sponsorships generated highly distributed audiences across multiple countries and regions. Others were concentrated in a smaller set of locations.
Some audiences engaged primarily from desktop devices, while others showed stronger mobile behavior.
Some campaigns produced a high percentage of unique visitors. Others generated more repeat engagement.
At a glance, all of those campaigns might look similar in a sponsorship report.
In reality, they were reaching very different audiences.
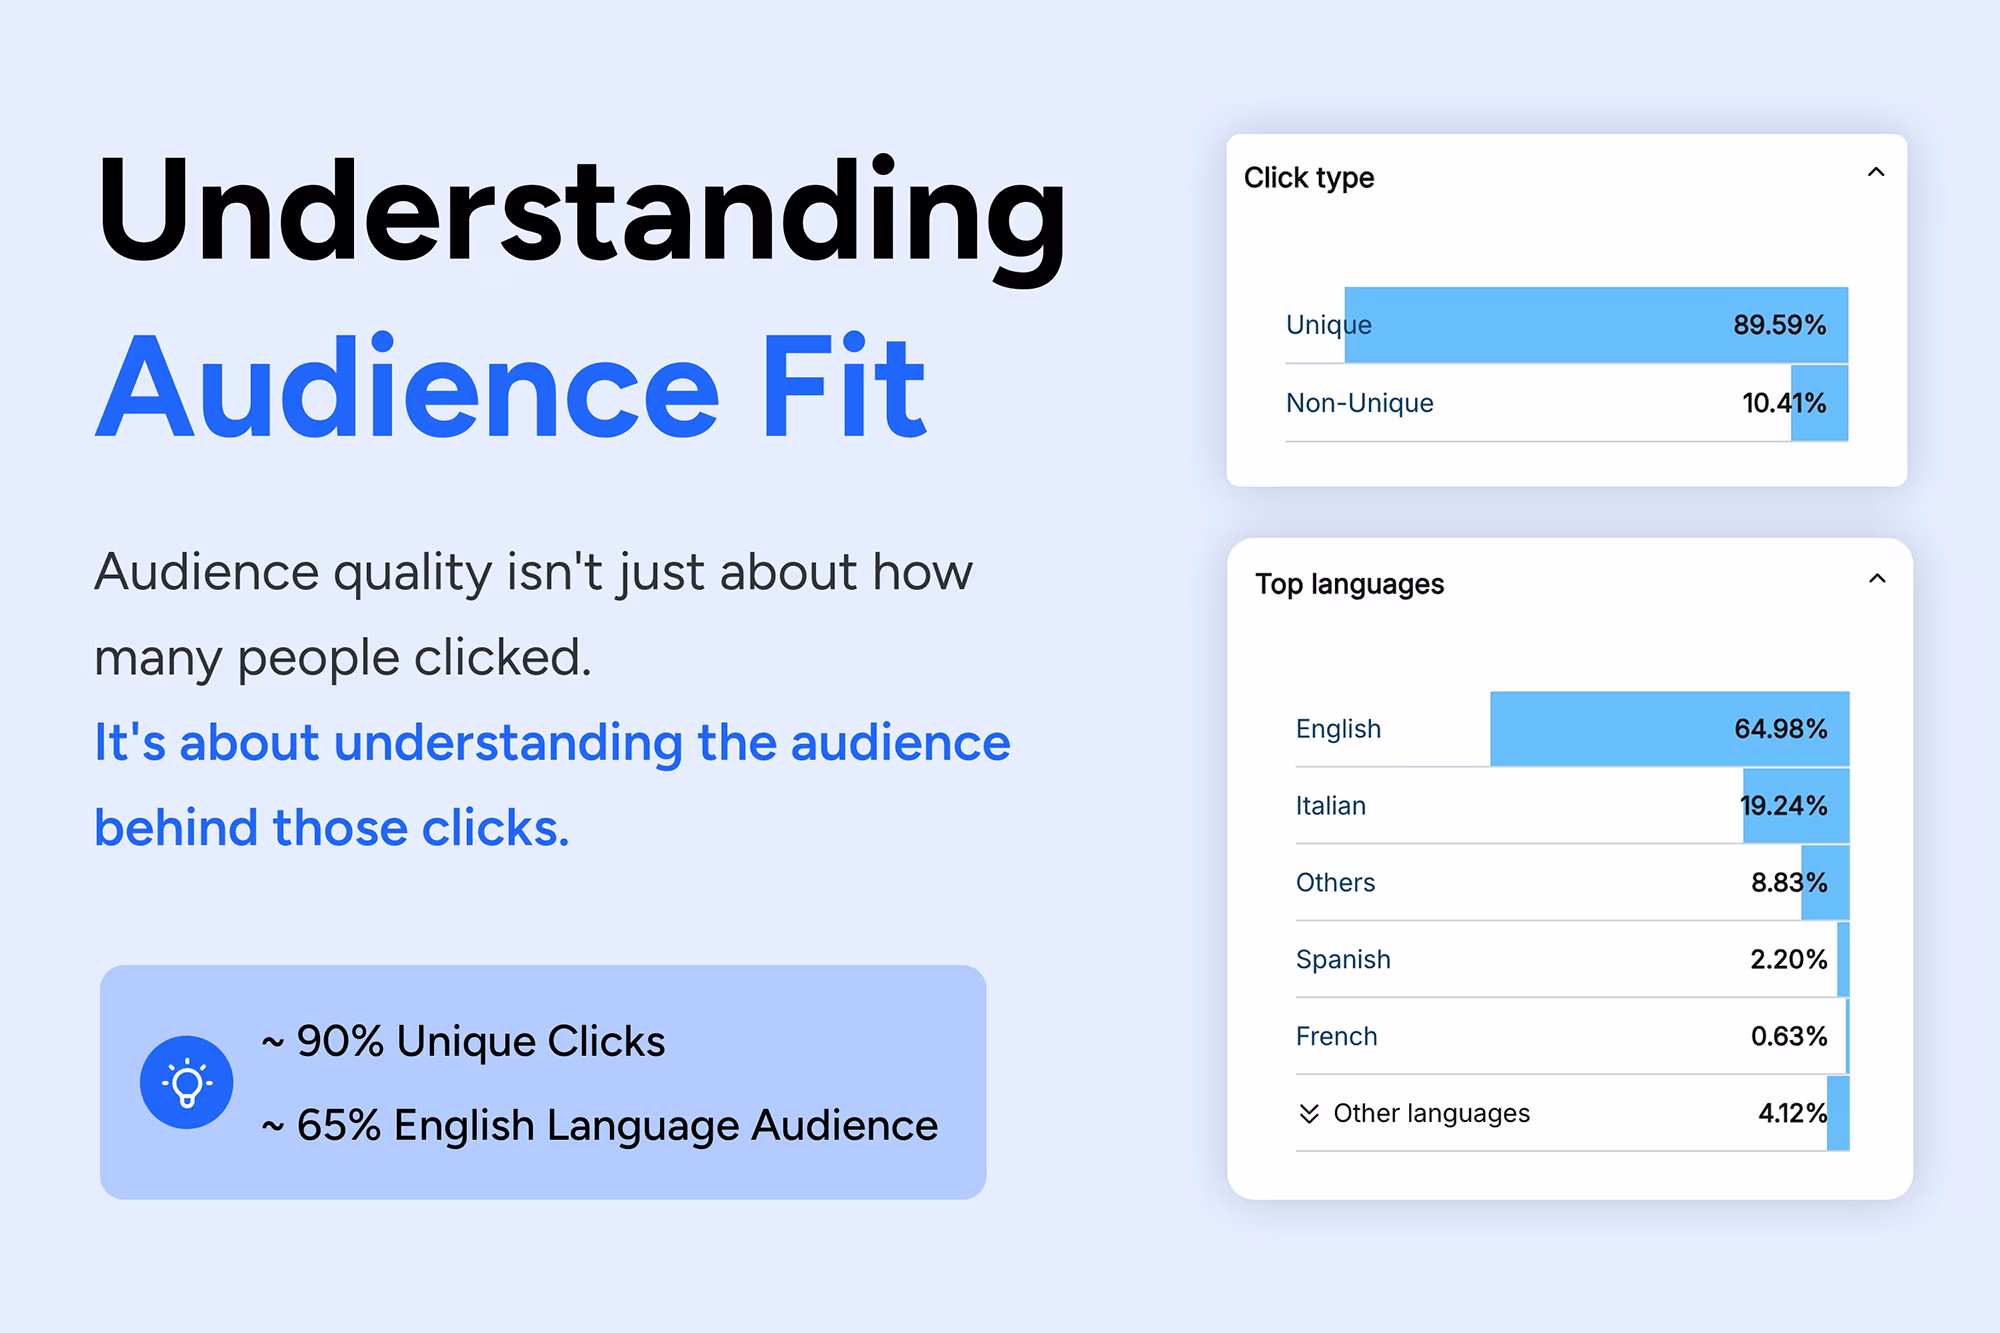
Understanding Audience Quality
The most valuable insight wasn't how many people clicked.
It was understanding whether the audience matched the people we were trying to reach.
By analyzing our own tracking data, we gained visibility into:
- Geographic distribution
- Device usage
- Browser and operating system preferences
- Languages
- Unique versus repeat visitors
- Time-of-day engagement
- Day-of-week engagement
These aren't vanity metrics.
They're signals that help marketers evaluate audience fit.
When you're investing in sponsorships, you're not just buying traffic. You're investing in access to an audience.
The better you understand that audience, the better decisions you can make about future investments.
Finding the Right Audiences
One of the most interesting outcomes from this analysis was that the sponsorships generating the strongest audience signals weren't always the sponsorships generating the most clicks.
As we reviewed the data, a pattern emerged.
The highest-performing placements shared several characteristics:
- Strong desktop engagement
- High percentages of unique visitors
- Consistent engagement patterns
- Geographic alignment with target markets
- Continued engagement beyond the initial newsletter send
A second group of sponsorships generated healthy traffic volume but appeared to reach broader audiences. These placements were valuable for awareness and reach but showed different engagement characteristics.
A third group generated smaller engagement volumes and provided less evidence of audience alignment.
Without first-party analytics, all of those clicks would have looked largely the same.
With first-party analytics, we could begin distinguishing between audience volume and audience quality.
How We Evaluate Newsletter Sponsorships
The experience helped us develop a simple framework for evaluating sponsorship performance.
Level 1: Engagement
These are the metrics most marketers already track:
- Clicks
- Click-through rate
- Cost per click
- Total traffic generated
These metrics tell us whether people engaged.
They're important, but they don't tell us much about the audience itself.
Level 2: Audience Quality
This is where first-party analytics become valuable.
We look at:
- Geographic distribution
- Device usage
- Unique versus repeat visitors
- Engagement patterns over time
- Audience consistency across campaigns
These signals help us determine whether a sponsorship is reaching the audience we intended to reach.
Level 3: Business Outcomes
Ultimately, marketing performance is measured by business results.
We track:
- Product signups
- Trial activations
- Demo requests
- Meetings booked
- Opportunities created
- Pipeline generated
- Revenue influenced
These metrics tell us whether engagement translated into business impact.
A sponsorship may perform well at one level and poorly at another. Looking at all three levels creates a more complete view of performance and helps us make better investment decisions.
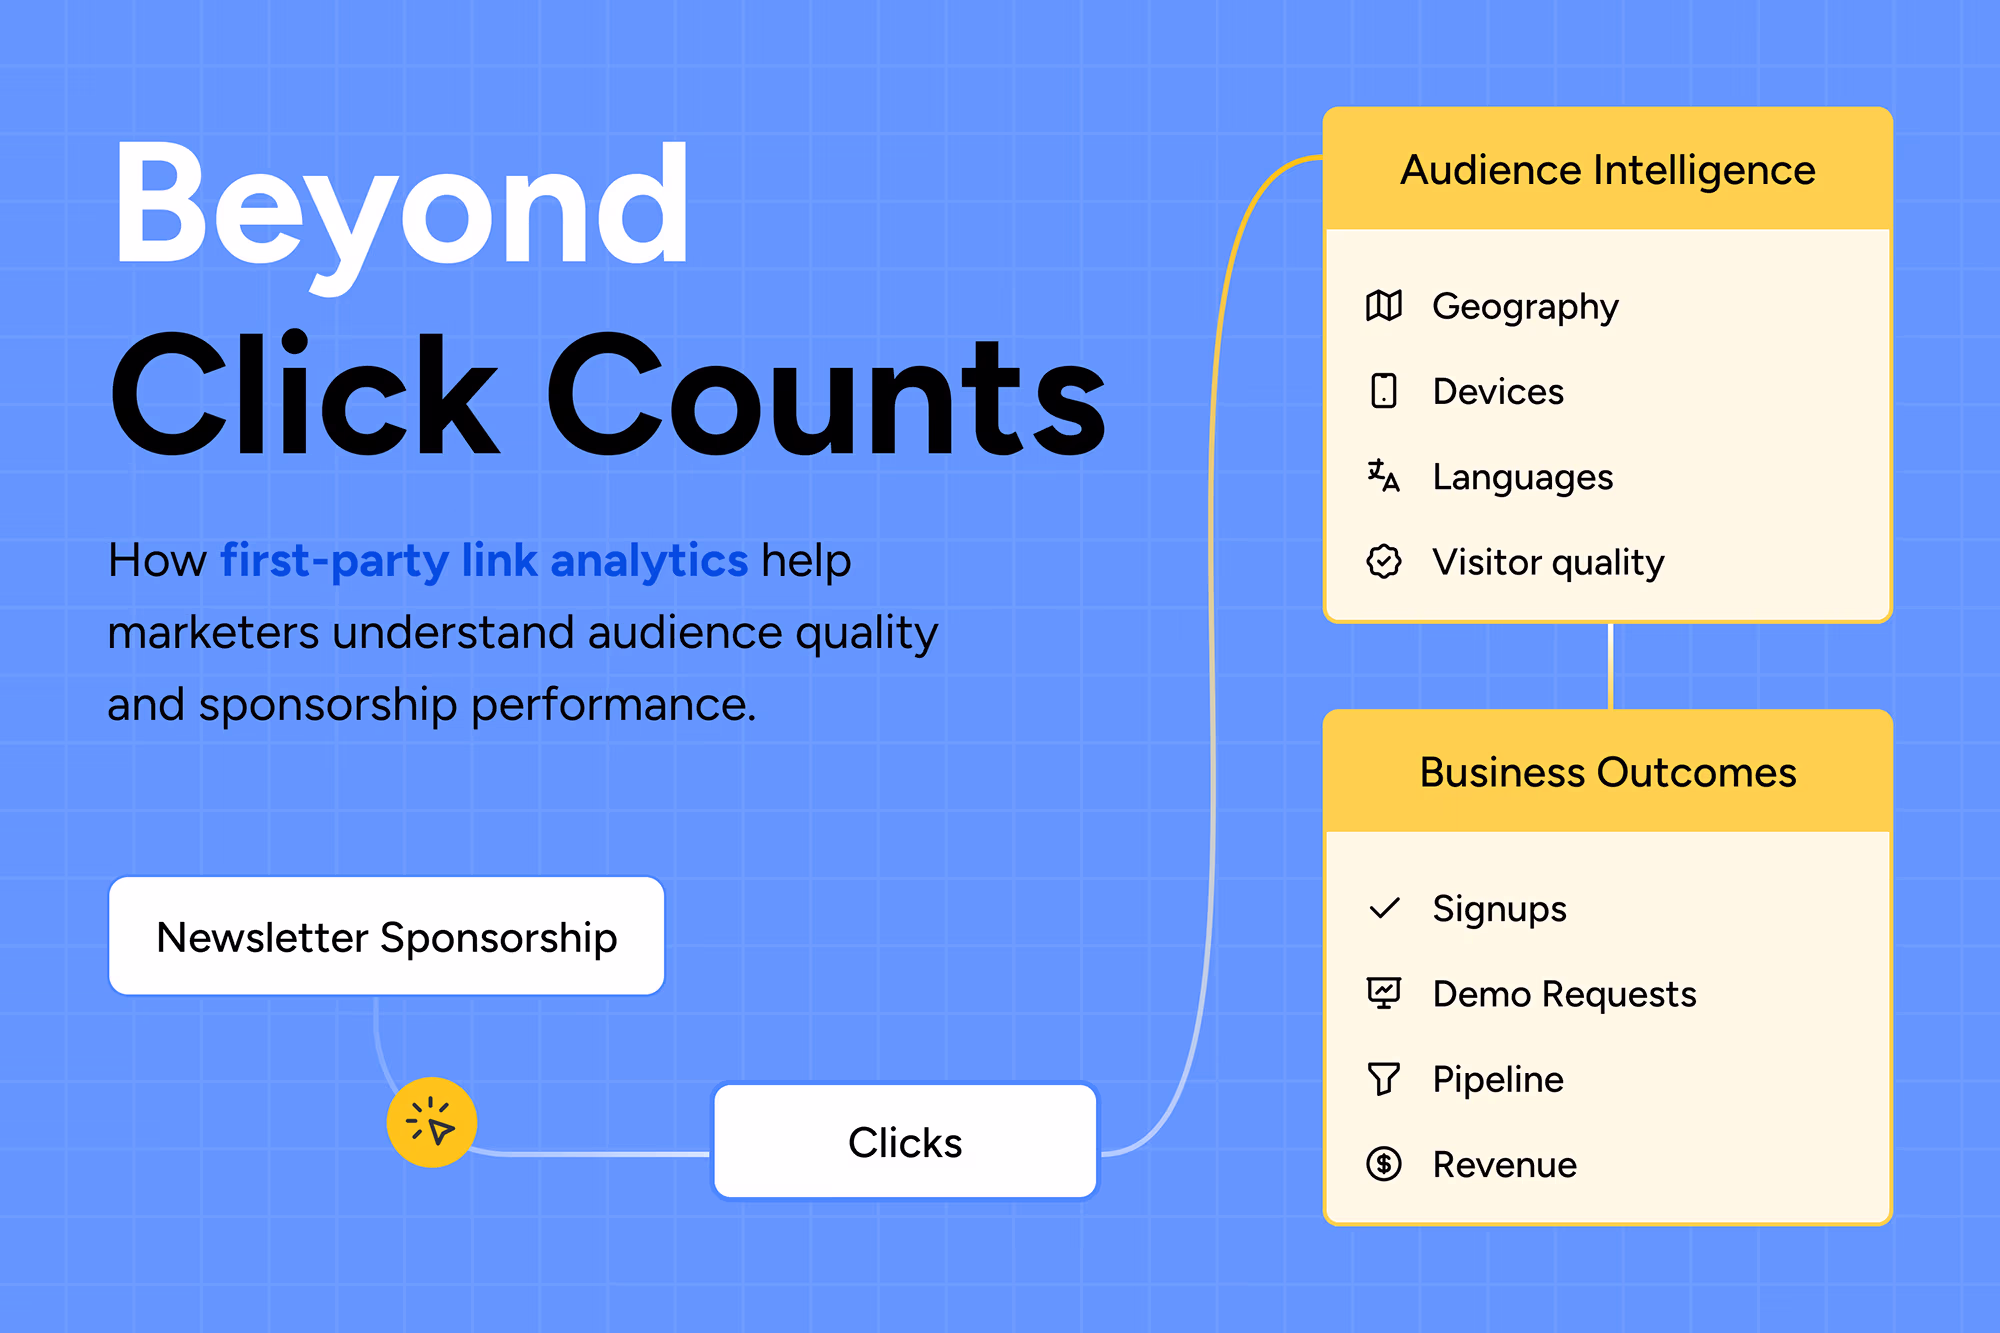
First-Party Link Analytics Help You Invest More Confidently
At this point, it would be easy to assume the lesson is simply that more analytics are better.
That's not really the takeaway.
As marketers, we're constantly balancing the need for insight with the risk of becoming overwhelmed by data.
The goal isn't to collect every possible metric.
The goal is to collect enough information to make better decisions.
When we reviewed our newsletter sponsorships, the biggest value wasn't discovering a discrepancy in click counts. The biggest value was understanding audience quality.
Some placements generated large volumes of traffic. Others generated smaller but more targeted audiences. Some skewed heavily toward desktop users. Others showed broader geographic reach. A few stood out as particularly strong fits for the audience we were trying to reach.
Without first-party link analytics, all of those clicks would have looked largely the same.
With first-party link analytics, we gained the context needed to make smarter decisions about future investment.
And when you're responsible for building pipeline, that context matters.
Because eventually every marketing team faces the same challenge:
How do we know this sponsorship actually delivered value?
First-party link analytics help answer that question with confidence.
Not because they generate more clicks, but because they help you understand whether you're reaching the right audience in the first place.
The Next Step: Connecting Clicks to Outcomes
Of course, audience intelligence is only one piece of the puzzle.
Most marketing teams already use UTM parameters, CRM attribution, marketing automation platforms, and reporting dashboards to understand performance. We care about signups, demo requests, meetings booked, opportunities created, pipeline generated, and revenue influenced.
Those are the metrics that ultimately matter.
But before any of those outcomes exist, someone has to click.
And before you can optimize for conversions, you need confidence that you're putting your message in front of the right people.
That's where first-party link analytics and conversion tracking become powerful together.
First-party link analytics help you understand audience quality.
Conversion tracking helps you understand business impact.
Combined, they create a complete picture of performance, from audience engagement to revenue generation.
We don't track newsletters because we're obsessed with metrics.
We track newsletters because we're trying to make better investment decisions.
Clicks tell us whether people engaged.
First-party analytics help us understand whether we're reaching the right audience.
Conversion tracking helps us understand whether that audience drives business outcomes.
Together, those signals create the confidence to scale what works and stop investing in what doesn't.
Because when it's time to deploy (or let's be real, request) additional budget, the strongest argument isn't that people clicked.
It's that the right people clicked.
And that's where things get really interesting.
Imagine being able to see not only who clicked your newsletter sponsorship, but who signed up for a free account, started a trial, booked a demo, created an opportunity, or became a customer.
First-party link analytics tell you whether you're reaching the right audience.
Conversion tracking tells you what that audience does next.
Together, they transform a newsletter sponsorship from a traffic source into a measurable growth channel.

.jpg)


