Links that
increase clicks
Stop losing conversions to generic URLs and start turning every link into a measurable brand asset.
Join marketers who love Rebrandly

Smart links that people trust
Generic short links look suspicious and hurt your CTR. Branded links that use your domain build instant recognition.
When links look professional and trustworthy, people engage. Branded links get 39% more clicks.
Update any link destination instantly, even after your campaign is live. Forgot a UTM parameter? Add or fix it after the fact without republishing.
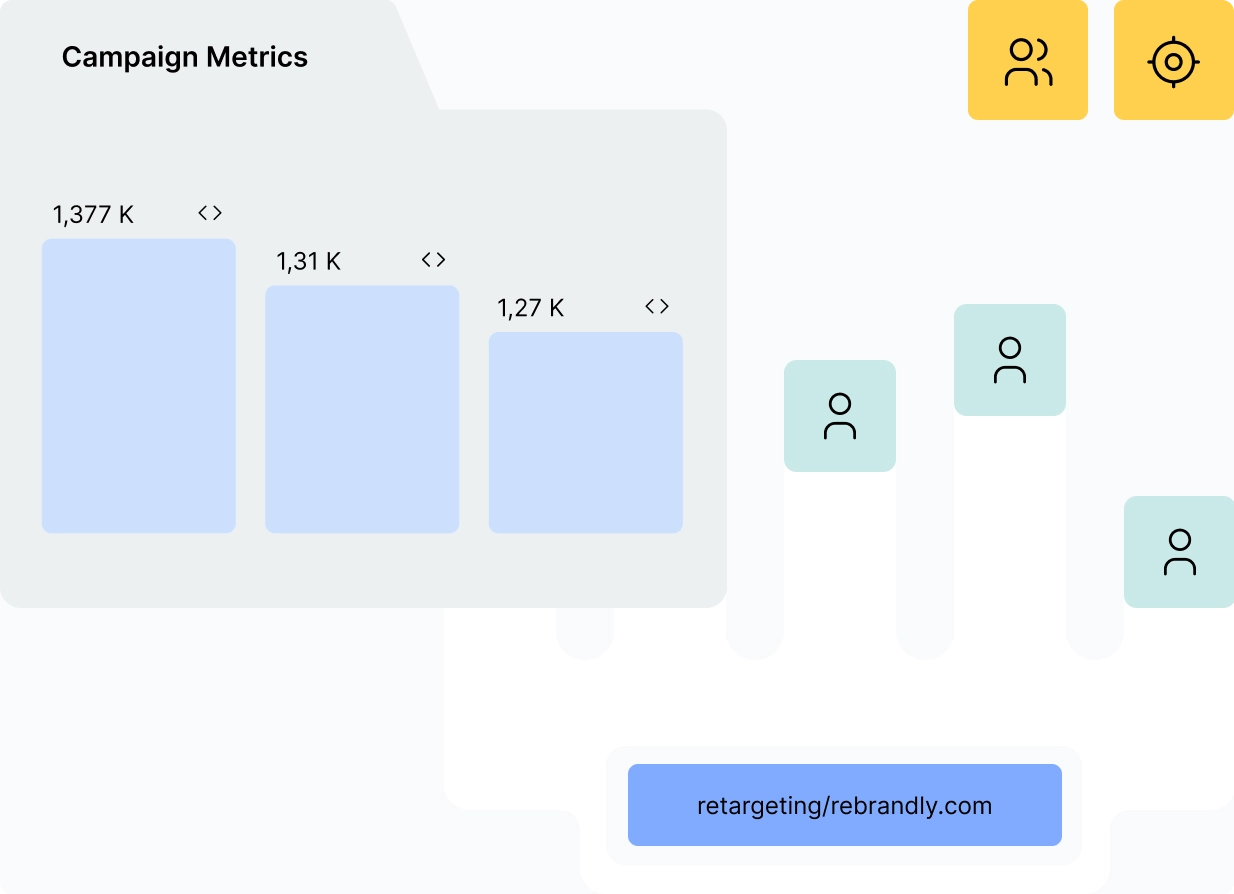
Track performance across every channel
See which campaigns drive clicks, when your audience engages, what devices they use, and where they're located.
Identify your top-performing content, and make data-driven decisions with unified reporting across all your channels.
Learn who is interacting with your links based on location, device type and language.

Route audiences to the right experience
Send mobile users to your app store listing and desktop users to your website automatically.
Direct audiences to location-specific pages or language-appropriate content based on where they click.
One link handles multiple destinations — no need to create and manage separate URLs for each audience.
Organize campaigns so nothing gets lost
Tag links by campaign, add notes for context, and keep your whole team working from shared workspaces.
Create hundreds of links at once using bulk operations, and apply retargeting pixels across batches in minutes.
Apply UTM parameters automatically across entire link libraries so tracking stays consistent.

Follow us


Download the app


